
Understanding the dashboards
Contact-based campaigns have two dashboards. You open both in the campaign list, see Open the dashboards. Each section is its own tab.
| Impressions dashboard | Performance dashboard | |
|---|---|---|
| Shows | How often the visuals were triggered, projected to impressions on shoppers | The effect: Conversion Rate, Basket Size, Sales Uplift |
| Comparison with and without C.A.P. | No | Yes, With C.A.P. (red) against Without C.A.P. (gray) |
| Sharing with the brand | Already during the campaign | After the dashboard has been released |
Every chart explains itself: click the three dots ⋮ at the top right of the chart and choose About this Visual. It describes what the chart shows and what its key figure means.
The tabs at a glance
Section titled “The tabs at a glance”Which tabs you see depends on the booked report. The title of each tab names it, for example «Basic Report (Free)» or «Premium Report (Paid)». See Reports at a glance.
| Tab | Report | What it shows |
|---|---|---|
| Impressions | Basic and Premium | Information on reach |
| Basic Performance | Basic | The three most important key figures for one analysis group: Conversion Rate, Basket Size and Sales Uplift |
| Performance | Premium | Conversion Rate, basket and Sales Uplift, referenced at analysis group level and for different time levels |
| Performance Comparison | Premium | A comparison of the analysis groups |
| Optimization | Premium | The performance figures by optimisable levels: weather, time, place, day and advertising pressure |
| Marketing Activities | Premium | The figures by created activity, with an area to customise two groups and key figures |
| AB Testing | Premium, optional | A comparison of the groups with each other |
Choose the analysis group
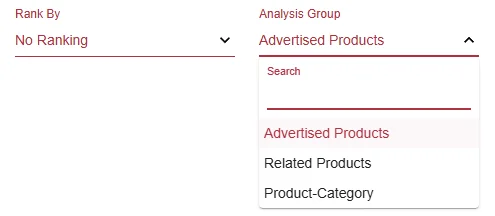
Section titled “Choose the analysis group”At the top right, under Analysis Group, you choose which products the key figures apply to, for example Advertised Products, Related Products or Product-Category.
Impressions
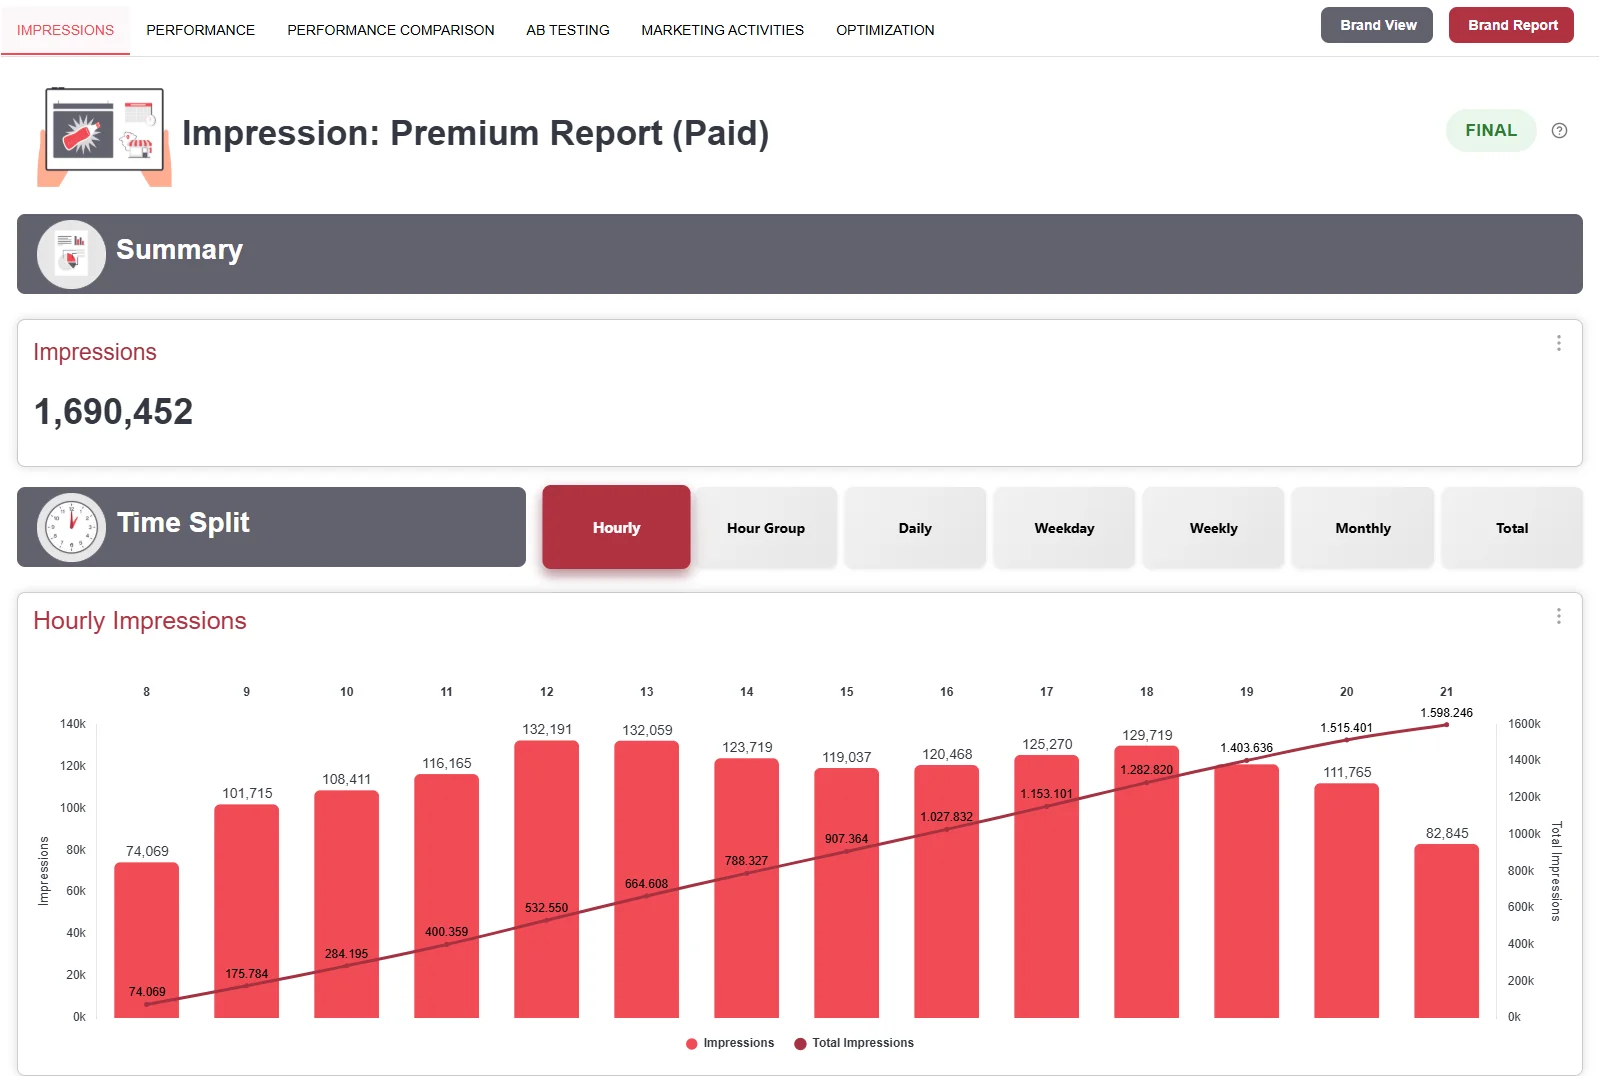
Section titled “Impressions”Cyreen counts how often the visuals were triggered and projects this to impressions on shoppers. This tab is included in every campaign.
Projection on methodik.cyreen.de- Summary: The total impressions.
- Time Split: The impressions by Hourly, Hour Group, Daily, Weekday, Weekly, Monthly or Total.
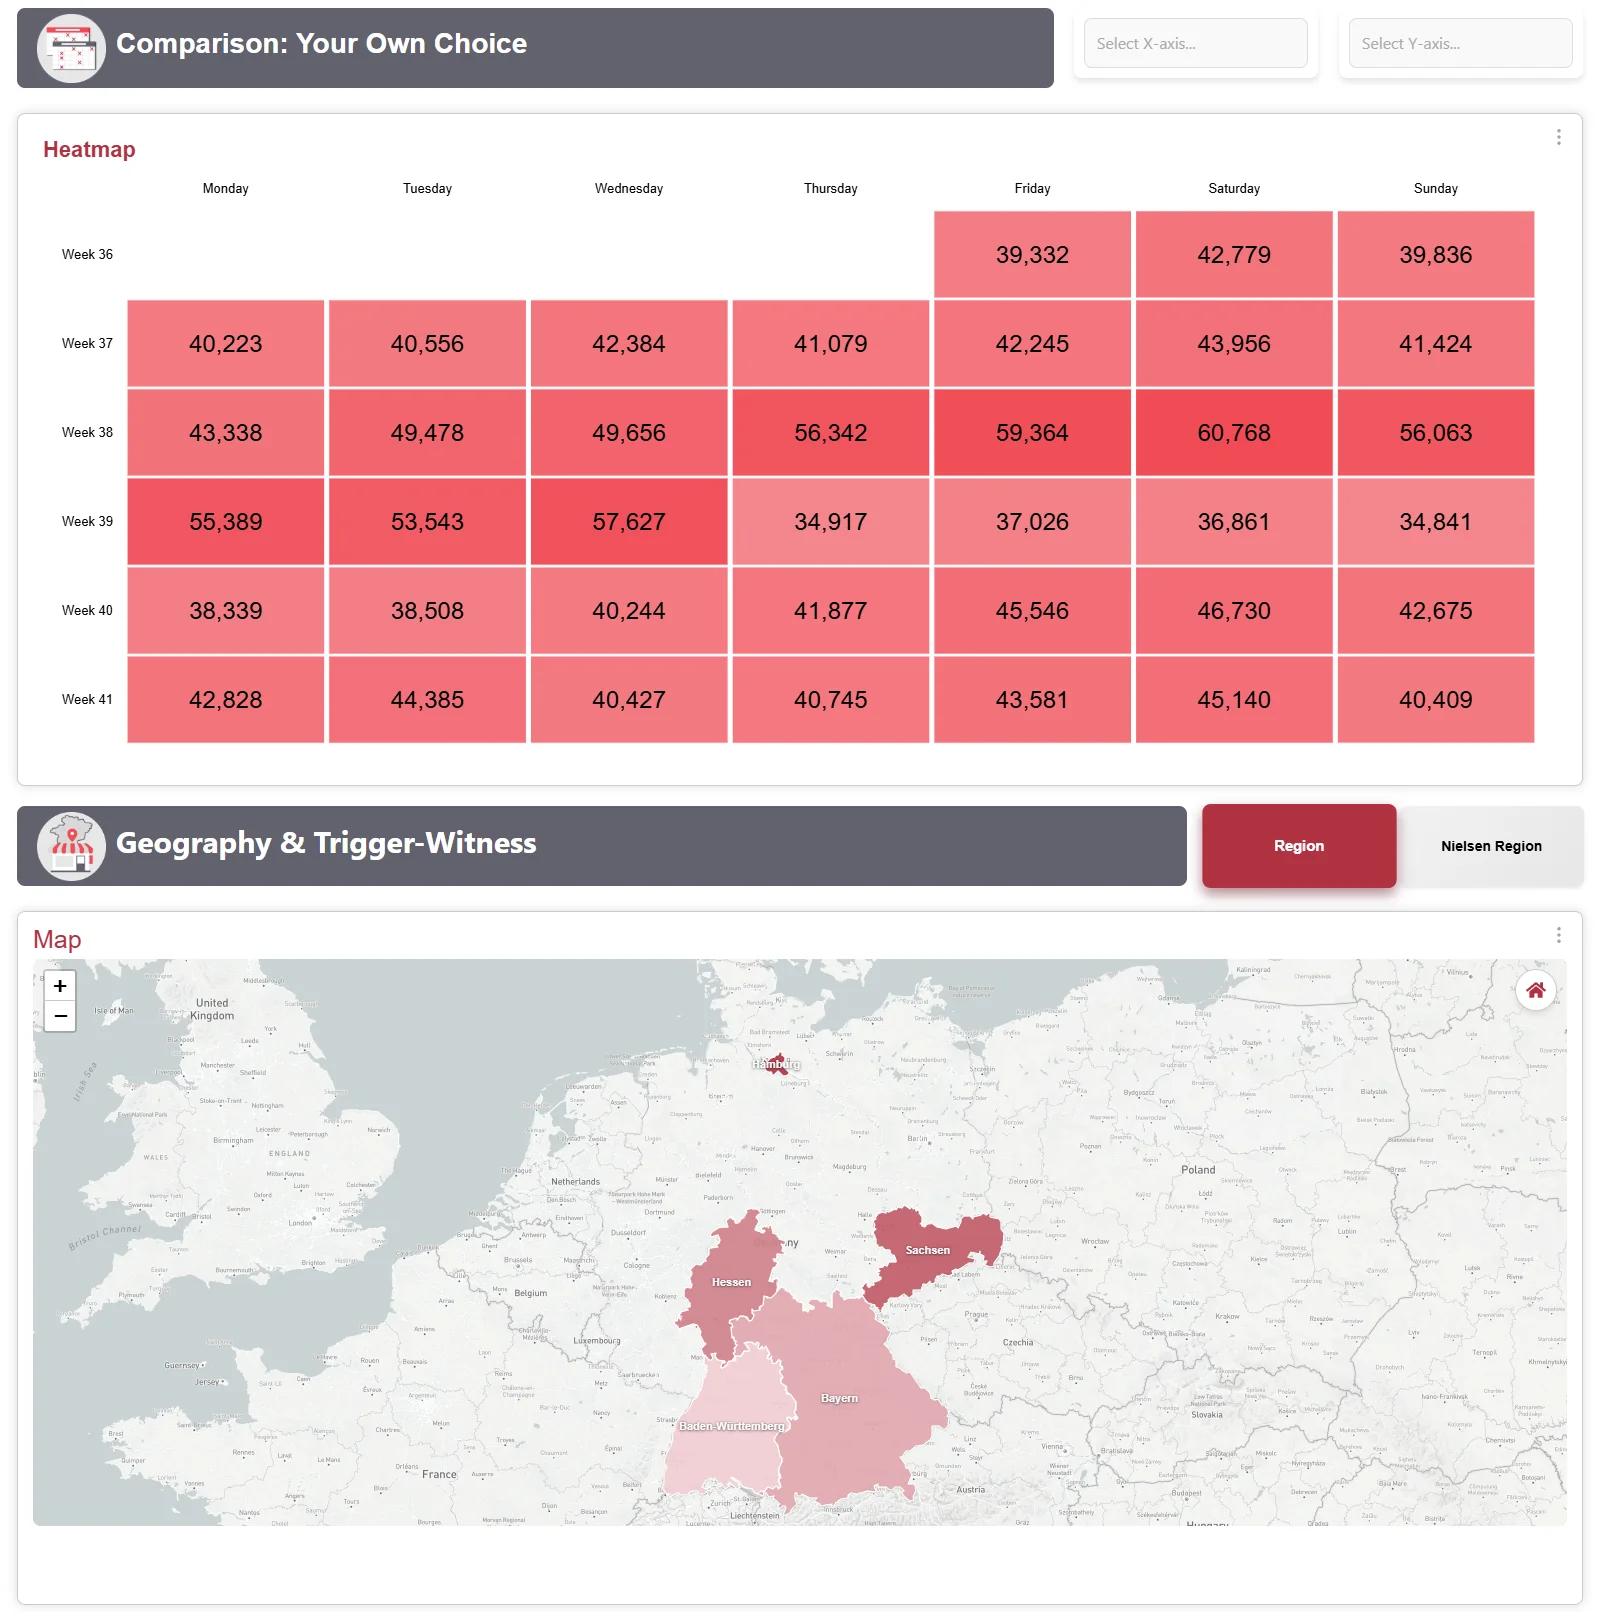
- Comparison: Your Own Choice: A heatmap that combines two time axes, for example hour group and week.
- Geography: A map with the impressions per federal state (Region) or Nielsen region (Nielsen Region).
Basic Performance
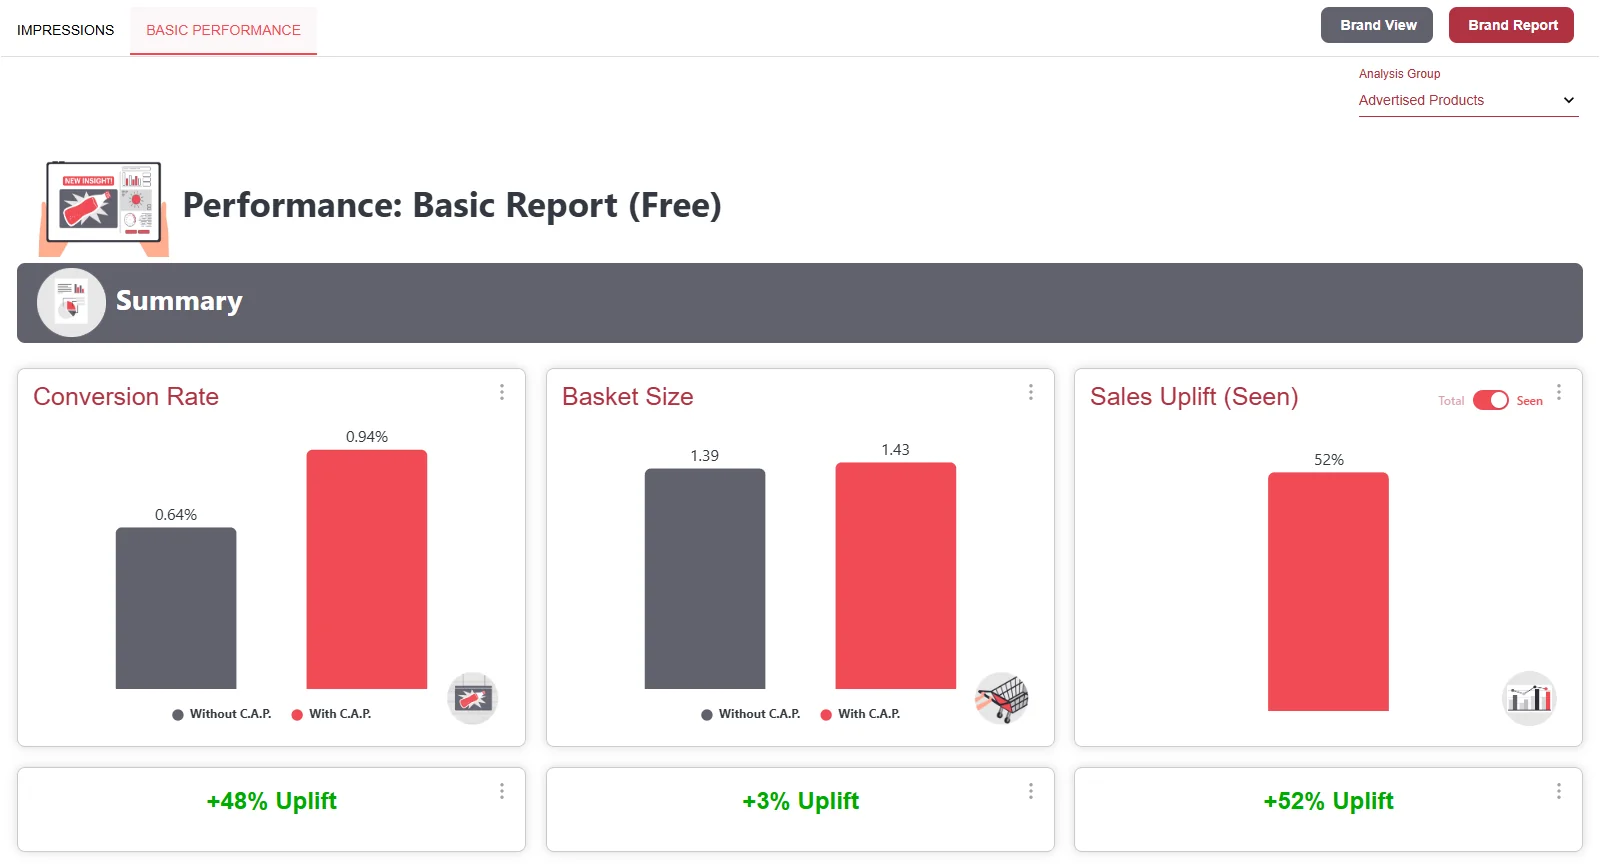
Section titled “Basic Performance”In the Basic Report, the Performance dashboard shows this one tab with the three most important key figures for one analysis group: Conversion Rate, Basket Size and Sales Uplift (Seen), each with the uplift underneath.
Premium tabs
Section titled “Premium tabs”In the Premium Report, the Performance dashboard has these tabs instead of Basic Performance. The tour shows how they are built.
Performance
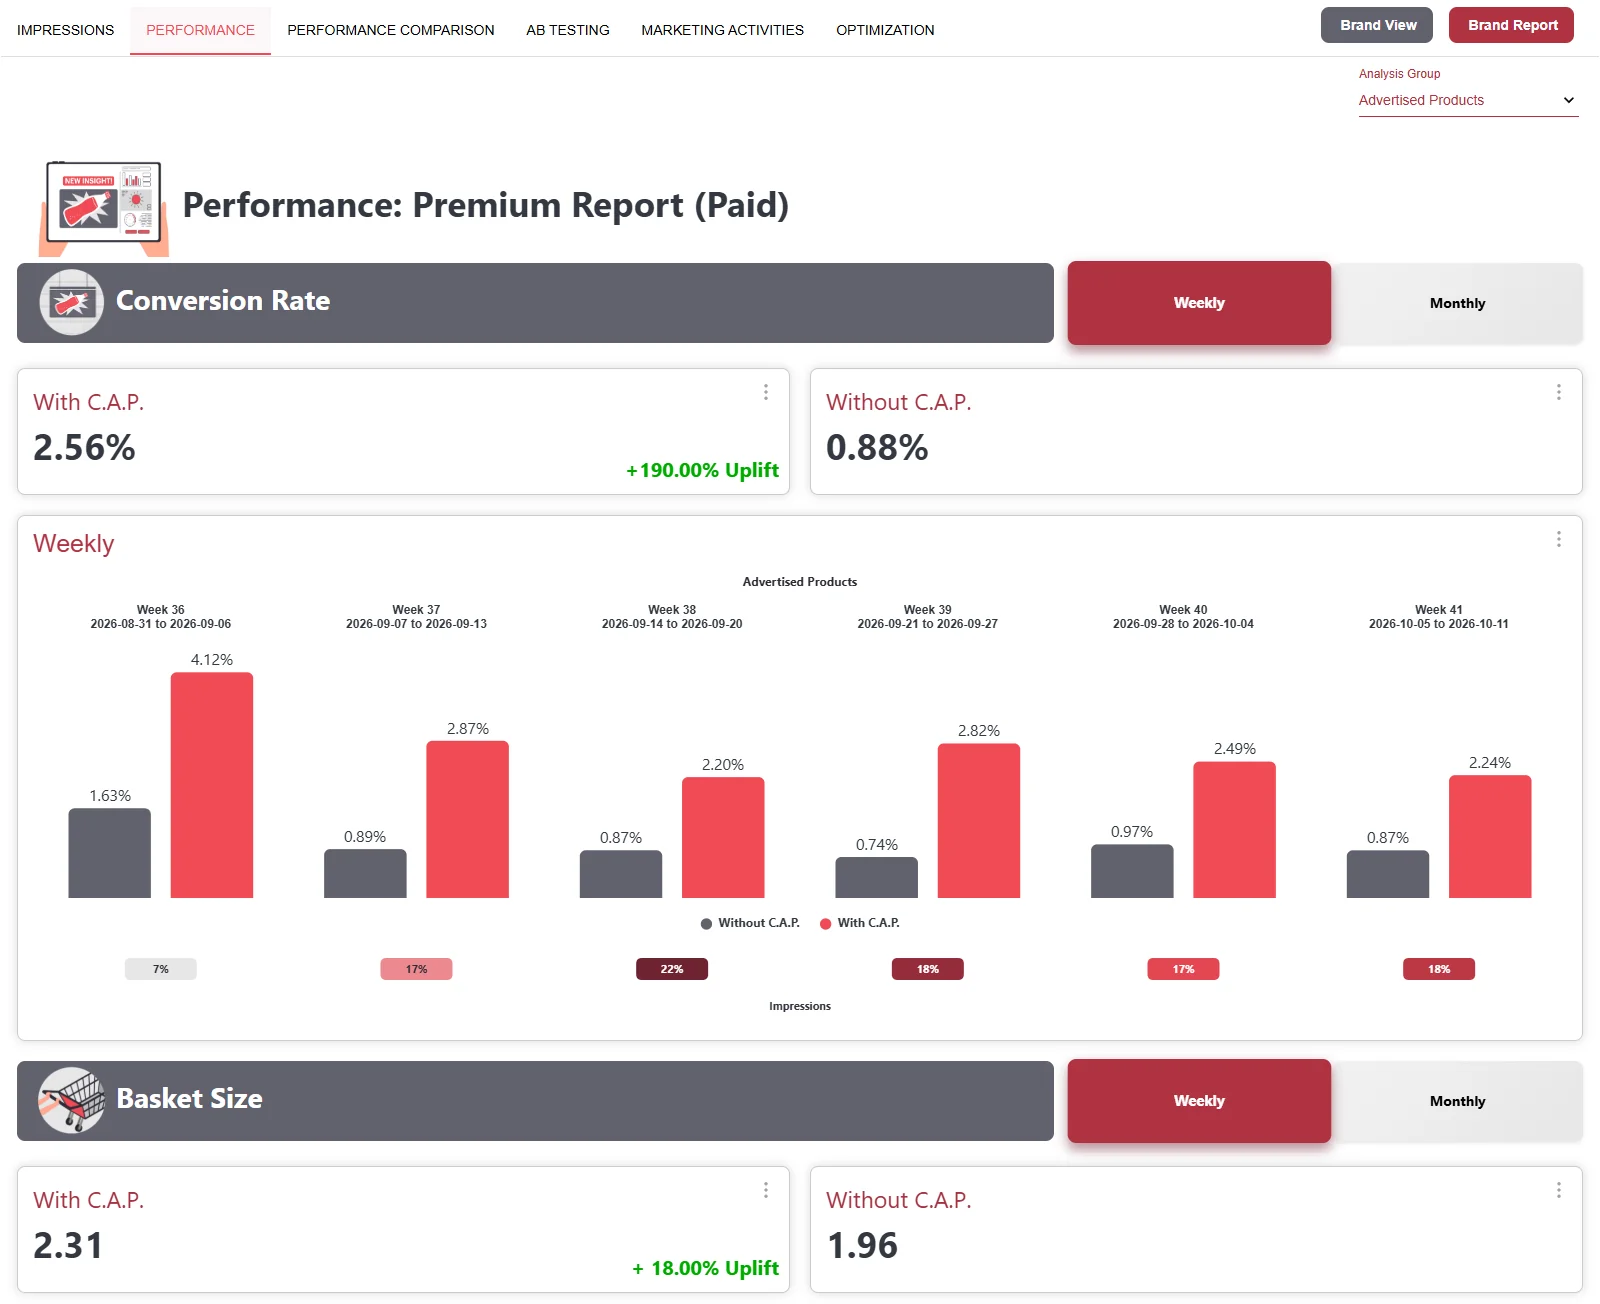
Section titled “Performance”Conversion Rate, basket and Sales Uplift of one analysis group over time, Weekly or Monthly. Under each pair of bars, you see the share of impressions in that week.
Performance Comparison
Section titled “Performance Comparison”Compares all analysis groups with each other. Best Analysis Group names the group with the strongest effect, Rank By Uplift sorts them.
AB Testing
Section titled “AB Testing”Compares two visuals of the same campaign: With C.A.P. Spot A and With C.A.P. Spot B, each against shoppers without ad contact. The tab tour above shows what this looks like.
Marketing Activities
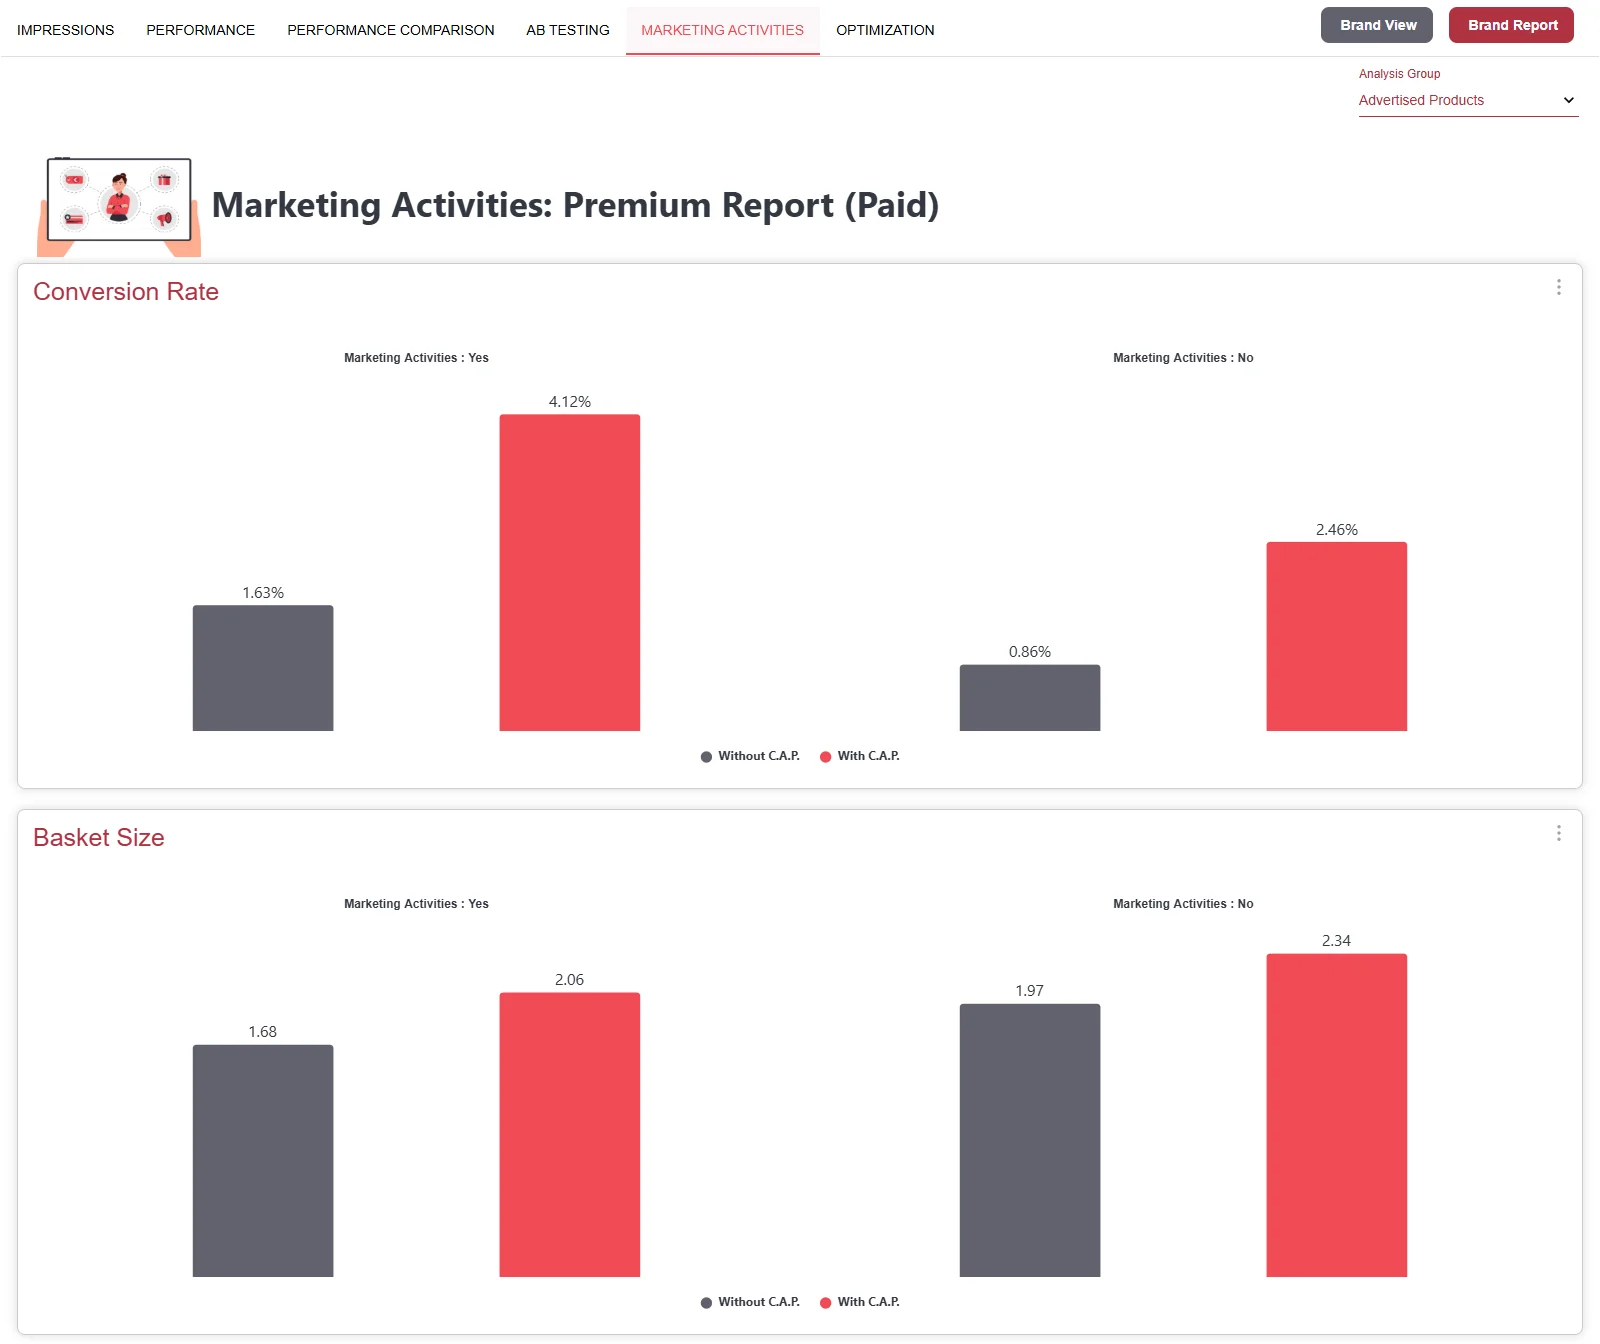
Section titled “Marketing Activities”Separates the effect into «with activity» (Marketing Activities: Yes) and «without activity» (No). Only the products assigned to the activity count as «with activity», and only in the weeks and stores of the activity. Other products of the same analysis group count as «without activity». Several activities in the same analysis group and week, for example a discount and a second placement, are evaluated separately. The assignment is made per product (GTIN), see Add marketing activities. This shows you whether a promotion strengthens the effect of the visual.
Optimization
Section titled “Optimization”Shows when and where the visual works best:
- Summary: Best hour group, best weekday, best weather group and best region.
- Daytime: Effect by Hour Group, Three Phases or 1. half vs. 2. half.
- Weekday: Effect per weekday.
- Geography: Effect per federal state or Nielsen region, as a chart and a map.
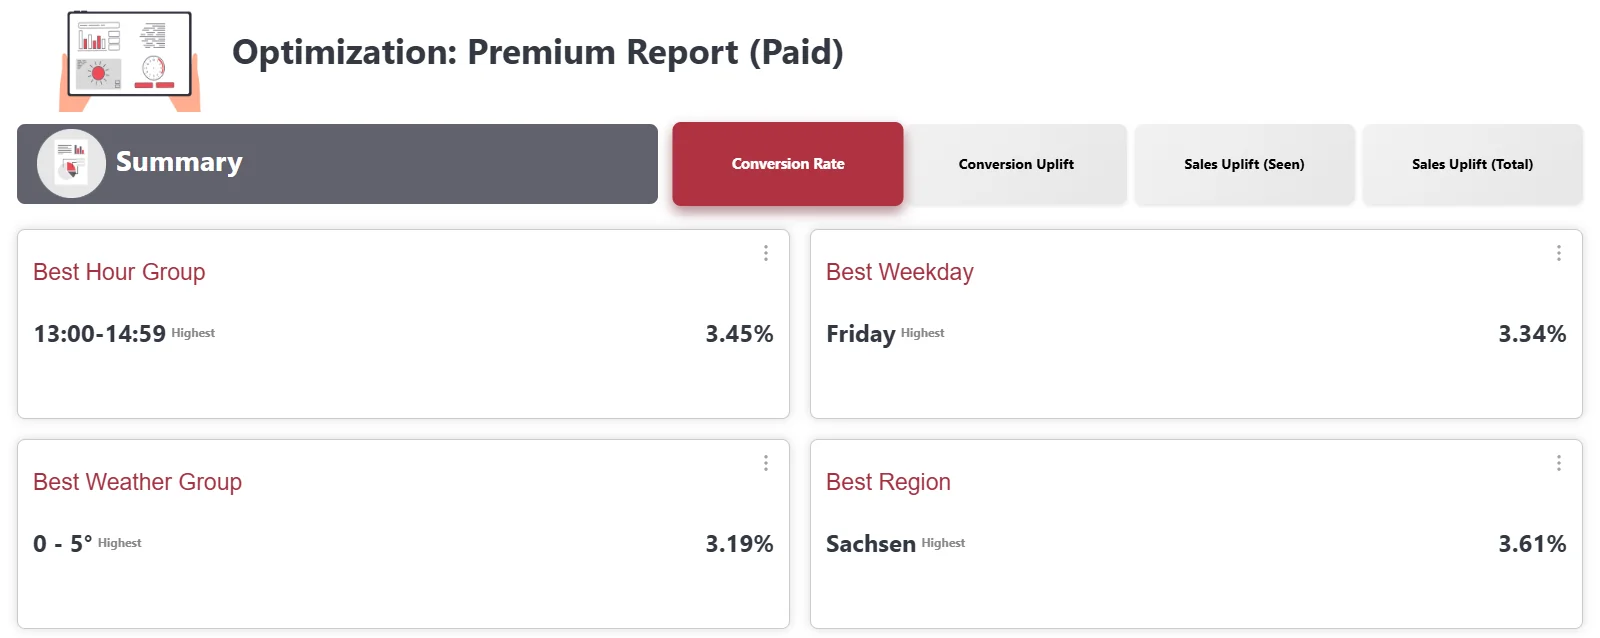
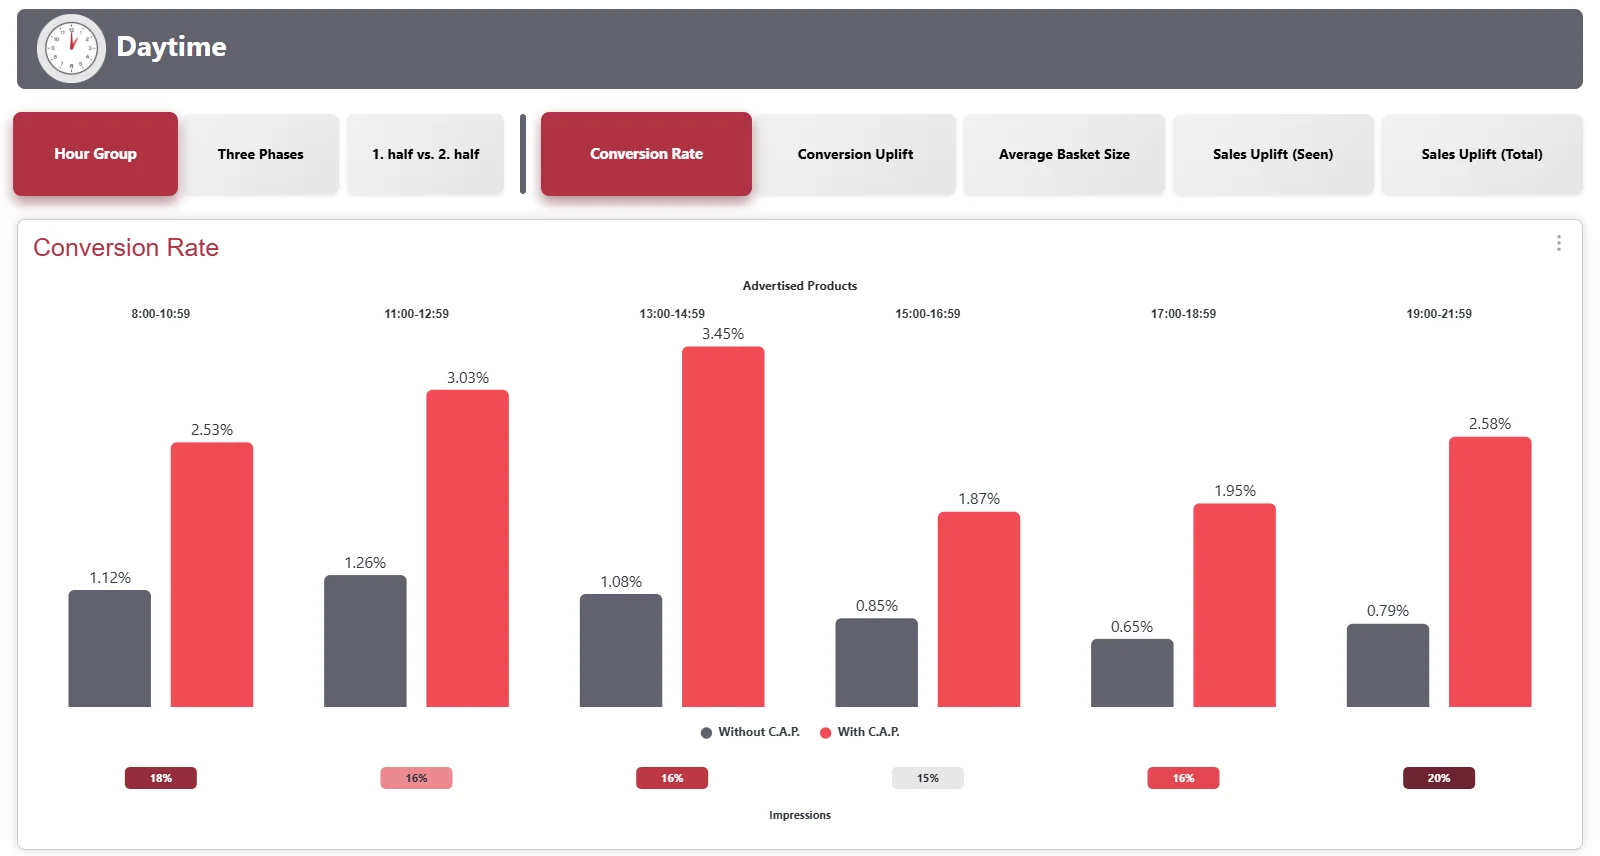
You choose the key figure at the top right in each case: Conversion Rate, Conversion Uplift, Average Basket Size, Sales Uplift (Seen) or Sales Uplift (Total). What they mean is described in Key figures.
Try it interactively
Section titled “Try it interactively”Click through the tabs of the dashboard, up to sharing with a brand.
Export data
Section titled “Export data”You export the data of a chart as an Excel file or the chart as an image, directly in the dashboard through the menu with the three dots. With the upcoming CAP Explorer release, there will also be an additional export dashboard for retrieving the contents.
-
Open the tab with the chart. Set the analysis group and the time period the way you want the data. The export takes over exactly this setting.
-
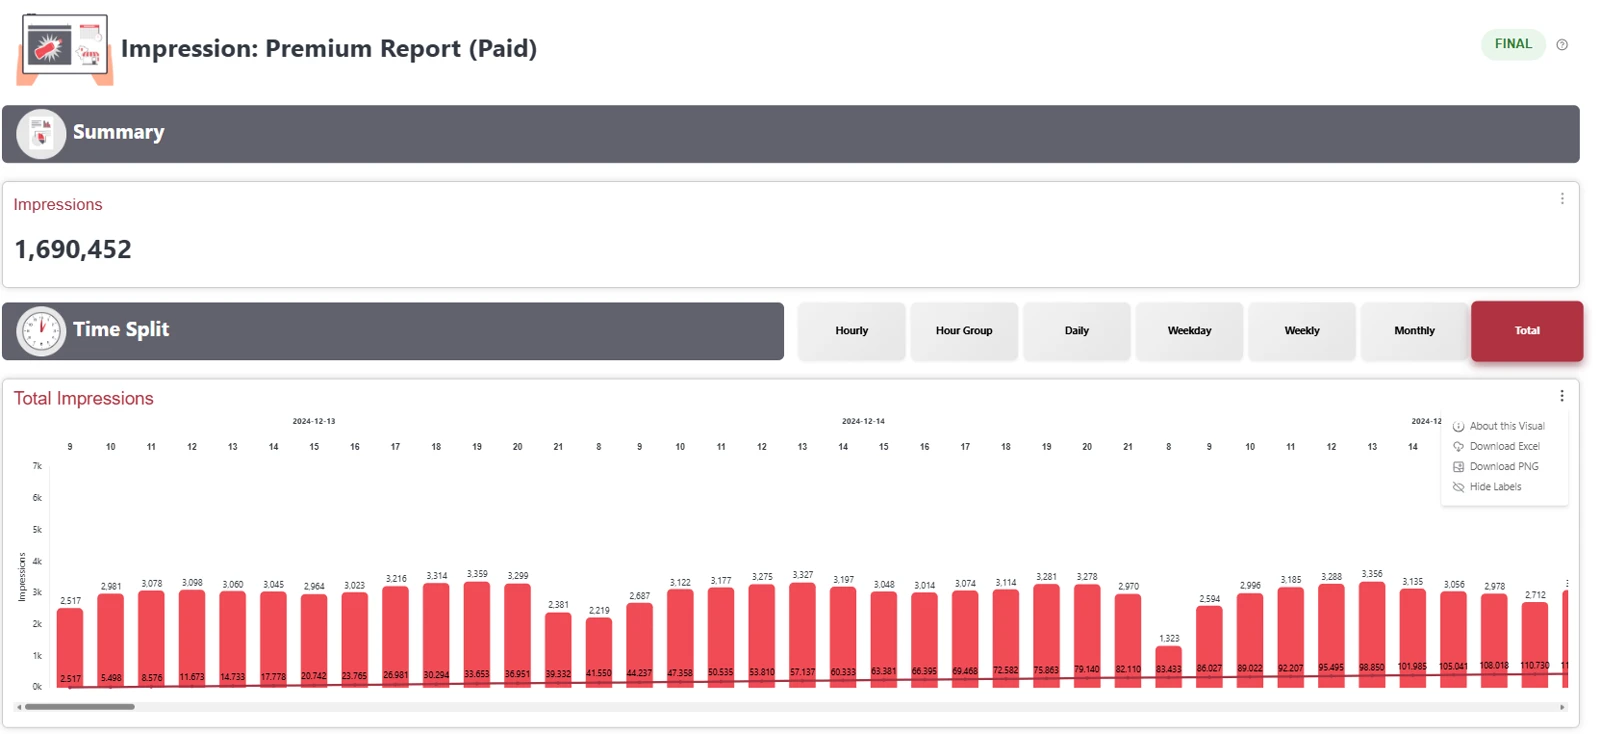
At the top right of the chart, click the three dots ⋮. Besides About this Visual, the menu offers:
- Download Excel: The data of the chart as an Excel file.
- Download PNG: The chart as an image, for example for a presentation.
- Hide Labels: Hides the numbers in the chart.
-
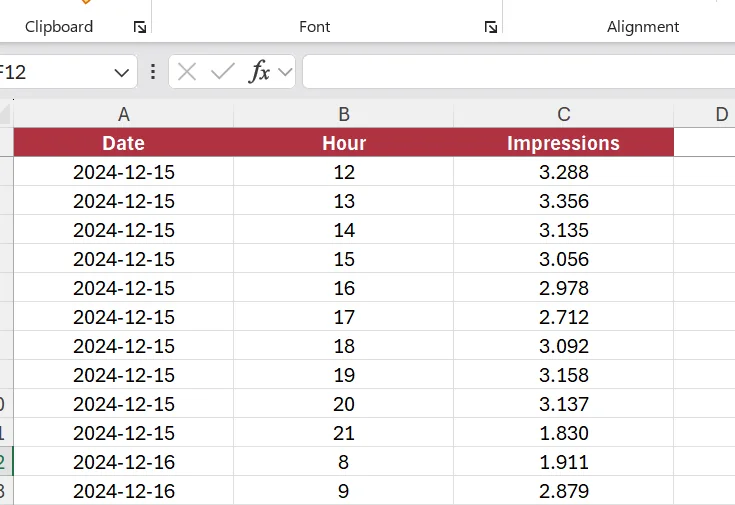
Select Download Excel. The file is saved in your download folder, for example as «Cyreen-CAP-Explorer-Impressions-2026-10-06.xlsx». It contains the values of the chart, with the selected filters and dimensions as columns next to them. For the Total Impressions chart, for example, these are Date, Hour and Impressions.
View a sample report
Section titled “View a sample report”An interactive sample report with Deep Dive Insights is available on the Cyreen website. You get the password from your Cyreen contact. If you do not have one yet, book a demo on cyreen.de, where you also get the password.
Open the sample report Book a demo on cyreen.deShare with a brand
Section titled “Share with a brand”The owner of the campaign, that is the company it belongs to, can share it. The user needs the share right, and a dashboard of the campaign must be ready. New with the upcoming CAP Explorer release: users of the type Cyreen User (for example BI and Support) can share all campaigns, regular Cyreen employees still only campaigns of their tenant. If you do not have the right, contact your Cyreen contact.
Help assistant
Answers from the Help Center, no AI